How to Read a Chart?
The Representation with Candlesticks Provides Important Advantages
First of all, charts graphically represent the price movements of stocks, indices, or other securities or products. The horizontal axis represents the period of time under consideration, and the vertical axis represents the price of the respective security. In the simplest form of representation, the line chart, there is only one price for each period, for example, a day, and this is usually the closing price. The connections of the points then form the line chart for a period.
Example for a line chart:
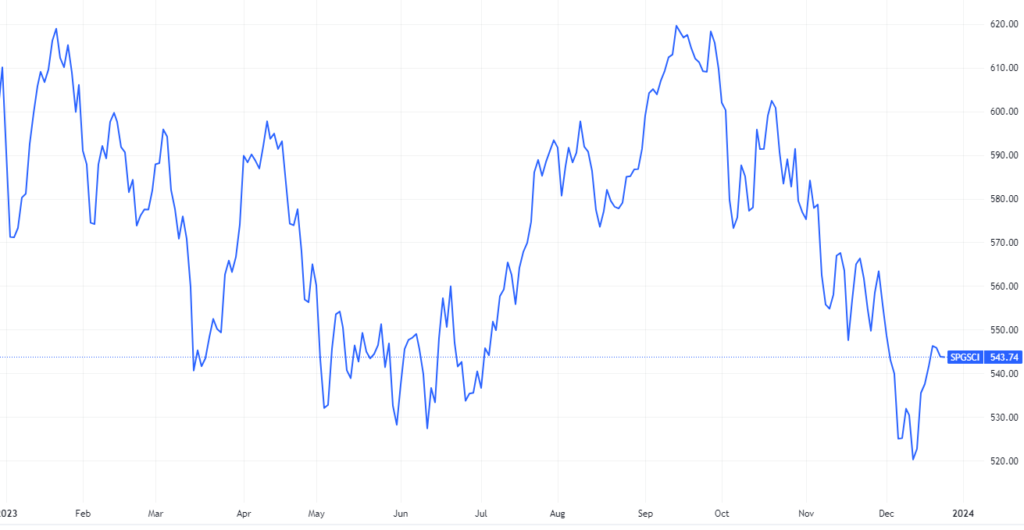
Daily fluctuations are an important additional piece of information:
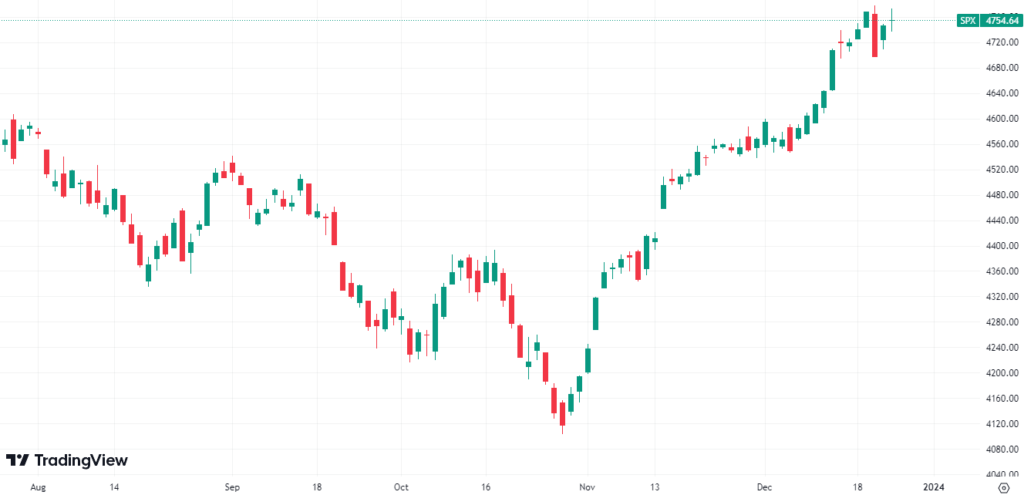
In the probably most commonly used form of representation, the candlestick chart, the information is presented in a more detailed manner. A white (or green) candle body indicates that the closing price on that day was higher than the opening price, indicating a daily gain. Conversely, with a black (or red) candle body (see example chart below), it is the opposite. The upper and lower boundaries of the candle body each represent the opening and closing prices. The wicks pointing upwards and downwards represent the maximum price fluctuations on that day or during the period depicted. This results in a clear presentation where you can quickly identify all the important information provided by the chart. By the way, the representation of charts with candlesticks is followed by the distinct method of candlestick analysis. This involves drawing conclusions about future price developments from the shape of the candles.
Example for a candlestick chart:
Our Conclusion:
The representation with candlestick charts is not always necessary; often, the line chart is sufficient. This is especially true when it comes to the long-term assessment of a market or a stock. However, the daily fluctuations of a security provide important additional information, as they are an indication of how uncertain the collective investors are in assessing a stock. It also indicates how high the short-term risk of loss is estimated. In cases of significant daily fluctuations, it is particularly important to set limits for buying or selling.
Newsletter
Subscribe to our newsletter and receive exclusive content such as compact analyses, investment ideas and more!
Service & Info
Payment
We accept all major credit cards, PayPal and cryptocurrencies.